What happened
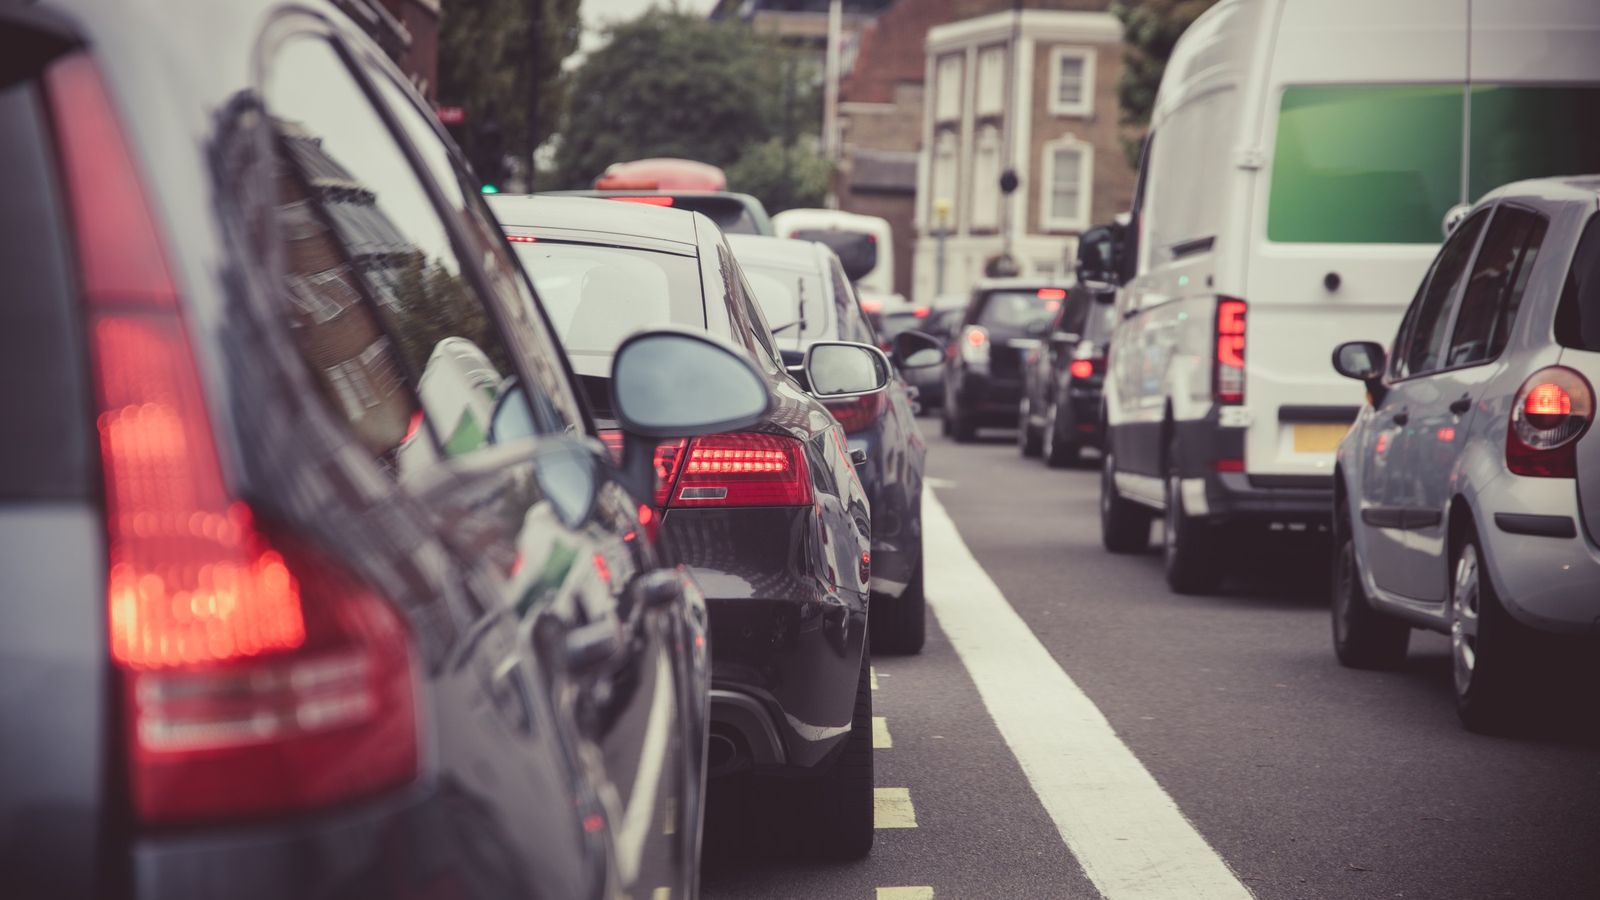
Car and road use in London is set to rise over the next decade under the draft London Plan, putting the mayor's goals on traffic and air quality in doubt, as Peter Walker reported for The Guardian on 19 November 2026. The figures come from Transport for London's interim transport modelling for the draft plan, published in July 2026 and picked up by the Transport Action Network campaign group.
In TfL's central case for 2036, against 2023, on a typical weekday:
- All trips: up from 24.9 million to 27.6 million, about 11%, as London grows towards 9.9 million people.
- Road trips: up 10%, from 8.3 million to 9.1 million. TfL's road figures cover cars, taxis, private hire, vans and lorries.
- Public transport: up 17%; walking and cycling up 6%, a slightly smaller share of all trips.
- Traffic speeds: down 7% across London, more in outer London.
- Vans: mileage up about 4% London-wide and 8% in outer London. Freight is about 18% of road traffic.
TfL's model assumes no new transport measures beyond those already committed. On that basis the share of trips by walking, cycling and public transport reaches 65% in 2036, against the mayor's target of 80% by 2041. The mayor's office told The Guardian the figures are modelling rather than a prediction, that they leave out recent changes such as pedestrianising Oxford Street, and that it expects walking and cycling to grow and car use to fall.
What it means for your business
More miles means more emissions, unless the vehicles change. Fuel burned in vans and cars your business owns or leases is Scope 1; staff driving their own cars for work is Scope 3 (business travel), and delivery firms you hire are Scope 3 (transport and distribution). If your London mileage rises with the city's, your footprint rises with it.
Slower roads cost time and fuel. TfL puts the extra congestion at 23,000 more hours lost in the morning peak hour alone in its central case. Stop-start driving tends to burn more fuel per mile than steady driving, so the real-world emissions of a diesel van in slower traffic may be higher than the average factors suggest.
Electric vans change the sum most. ULEZ already pushes fleets towards cleaner vehicles, and the same switch is where the carbon savings are, as our examples show.
Worked examples
- An outer London firm with 6 average diesel vans at 20,000 km each: 30.86 tonnes CO2e a year at the 2026 government factor.
- With mileage 8% higher, as TfL models for vans in outer London: 33.33 tonnes.
- The same higher mileage in battery electric vans, charged from the UK grid: 5.52 tonnes.
What to do now
- Record mileage, not just fuel spend. Kilometres per vehicle, per year, is what you need to see whether a rise in emissions comes from more driving or from the vehicles.
- Separate London from the rest. If you run vehicles in and out of London, tracking London mileage on its own shows the effect of congestion and zone charges.
- Price the switch on carbon as well as cost. When a van is due for replacement, compare the diesel and electric emissions for your real mileage before choosing.