What happened
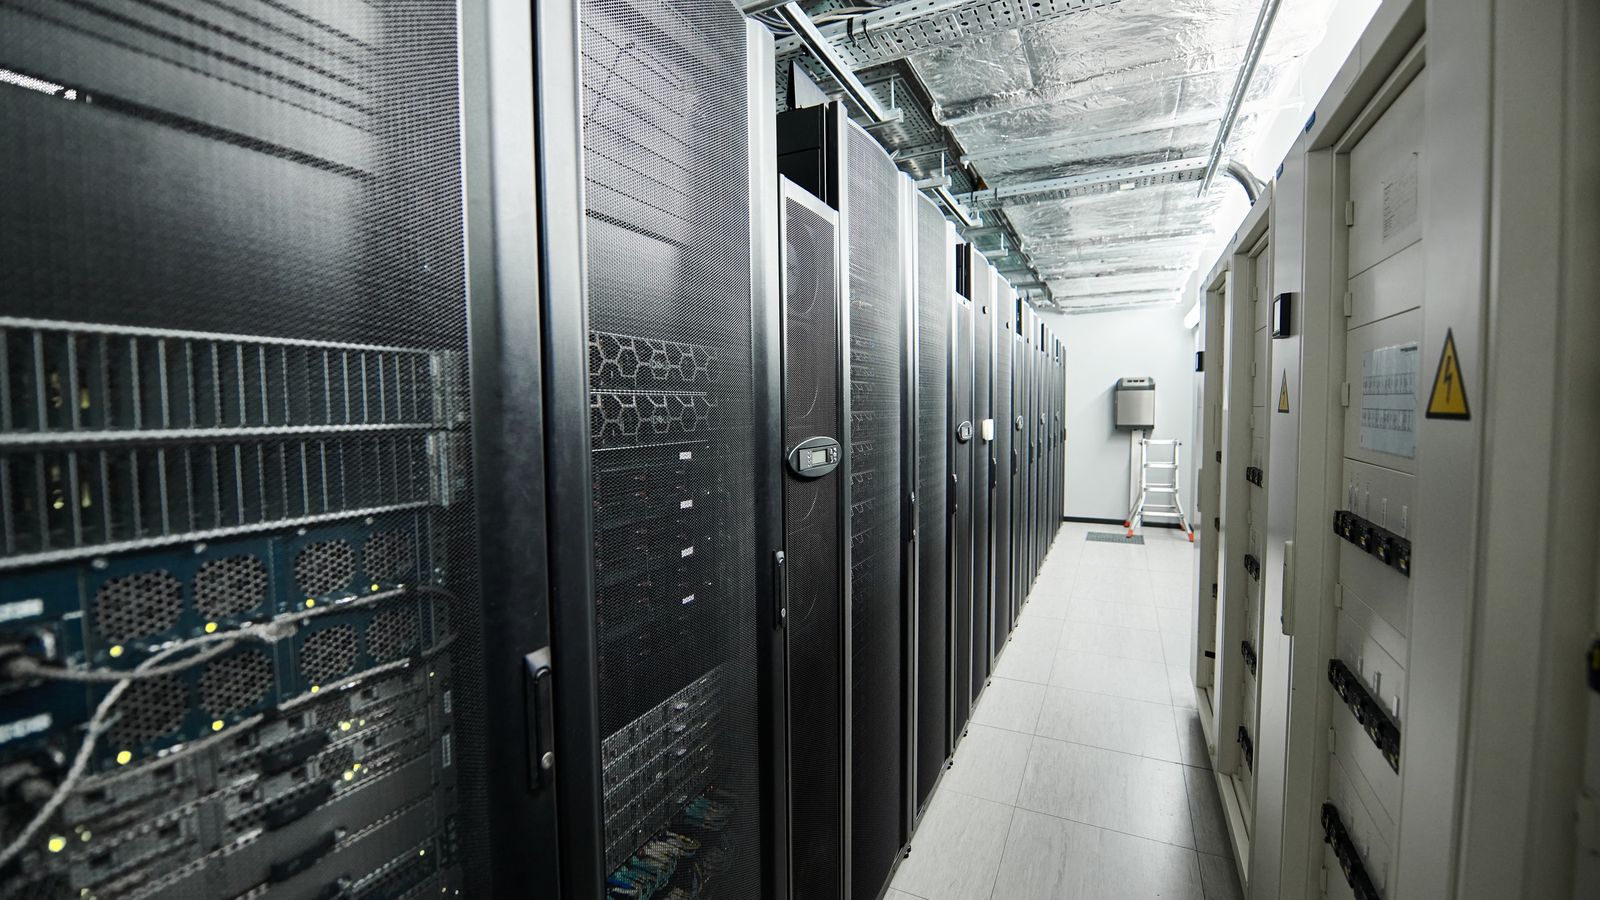
Researchers led by the Harvard T.H. Chan School of Public Health published a study in Nature Sustainability on 16 November 2026 that maps 403 hyperscale data centres in the US, the largest class of sites, which run cloud services and AI, and estimates their electricity use and the CO2 linked to it between May 2024 and April 2025. As Dan Robinson reported for The Register, the team found the sites using a larger data centre dataset, satellite images and building outlines, and worked out each site's use from its electrical capacity and how hard it was assumed to run, rather than from meter readings.
The main findings, from the study's own summary:
- Electricity: 68 to 99 TWh across four scenarios, with a central estimate of 82 TWh, about 1.8% of all US electricity use.
- Carbon: 21 to 31 million tonnes of CO2, central estimate 25.7 million, by matching each site to the power plants in its regional grid using plant-level data.
- Fuel mix: about 54% of the electricity attributed to the sites came from fossil fuels, mainly gas and coal according to The Register.
- Intensity: about 314 g CO2 per kWh for the sites, slightly below the US average of 348 g.
The Register reports that the central emissions figure is two to three times an earlier estimate of about 10.5 million tonnes for 2018, and that the top scenario approaches the electricity use of a whole state such as Indiana, Michigan or Tennessee, each about 100 TWh. The researchers say demand is likely to be higher now, and that they could not separate AI work from general computing at each site.
What it means for your business
Your cloud use sits in your Scope 3. If you rent servers, storage or AI tools, the electricity behind them is the provider's Scope 2 and your Scope 3 (purchased goods and services). Most large providers now give customers an emissions or energy figure for their account. This study is a reminder that those figures are estimates too, and that the method matters.
Location matters as much as size. The study's sites were slightly cleaner than the US average because of where they are built. The same work run in a different region, on a different grid, can carry very different emissions. If your provider lets you choose a region, that choice affects your footprint.
The study counts CO2 only, location-based. It uses each grid's average mix, not any renewable power the operators buy. That is the same approach as the location-based Scope 2 figure every UK business reports, so it is the right figure to compare with your own.
Our sums: the same electricity in the UK
- The study's central 82 TWh drawn from the UK grid, at the 2026 government factor of 0.13096 kg CO2e per kWh, comes to about 10.7 million tonnes CO2e, against the study's 25.7 million tonnes of CO2 in the US.
- Per kWh, that is 131 g on the UK factor against 314 g for the US sites. The UK factor covers generation only and includes methane and nitrous oxide, so treat this as a rough comparison, not a like-for-like one.
- A UK business whose provider reports 20,000 kWh for its workloads in a year: 2.62 tonnes CO2e if run in the UK at the government factor, or about 6.28 tonnes at the study's US hyperscale average.
Our recent posts on BloombergNEF's data centre power report and the Data Centre Covenant cover the UK side of the boom.
What to do now
- Ask your cloud and AI providers for an annual figure. Electricity in kWh or emissions in kg CO2e for your account, and whether it is location-based or market-based.
- Note the region your workloads run in. It decides which grid factor applies, and it is the one setting that can change the number without changing what you do.
- Put it in Scope 3. Record cloud services under purchased goods and services, with the provider's figure as the source, and keep the method with it so next year's number compares fairly.