What happened
Clean Cities, a European campaign group for clean urban transport, published its 2026 Free to Breathe ranking of 40 major European cities on 17 November 2026. It scores each city on four counts: current levels of nitrogen dioxide (NO2) and fine particles (PM2.5), whether the city would already meet the EU's tougher 2030 limits, how much pollution has fallen over the past decade, and four transport measures (low and zero-emission zones, electric buses, protected cycle lanes and school streets). As Lucy King reported for Energy Live News, London received a C.
From Clean Cities' release and full report:
- Only three cities pass. Copenhagen, Greater Stockholm and Greater Helsinki are the only cities that already meet the EU's 2030 limits for both pollutants, so 93% of the cities studied would likely breach them. None meets the World Health Organization's guidelines.
- London is 16th, with 34.1 points out of 60. Its three-year average NO2 level is 23.4 micrograms per cubic metre, against an EU 2030 limit of 20; PM2.5 is 9.4, just under the limit of 10. It scored zero on compliance with the four 2030 limits Clean Cities tested.
- But London has improved a lot. NO2 fell by 46.3% and PM2.5 by 27.1% between 2016-2018 and 2023-2025. Clean Cities names London's Ultra Low Emission Zone among the policies behind the largest falls.
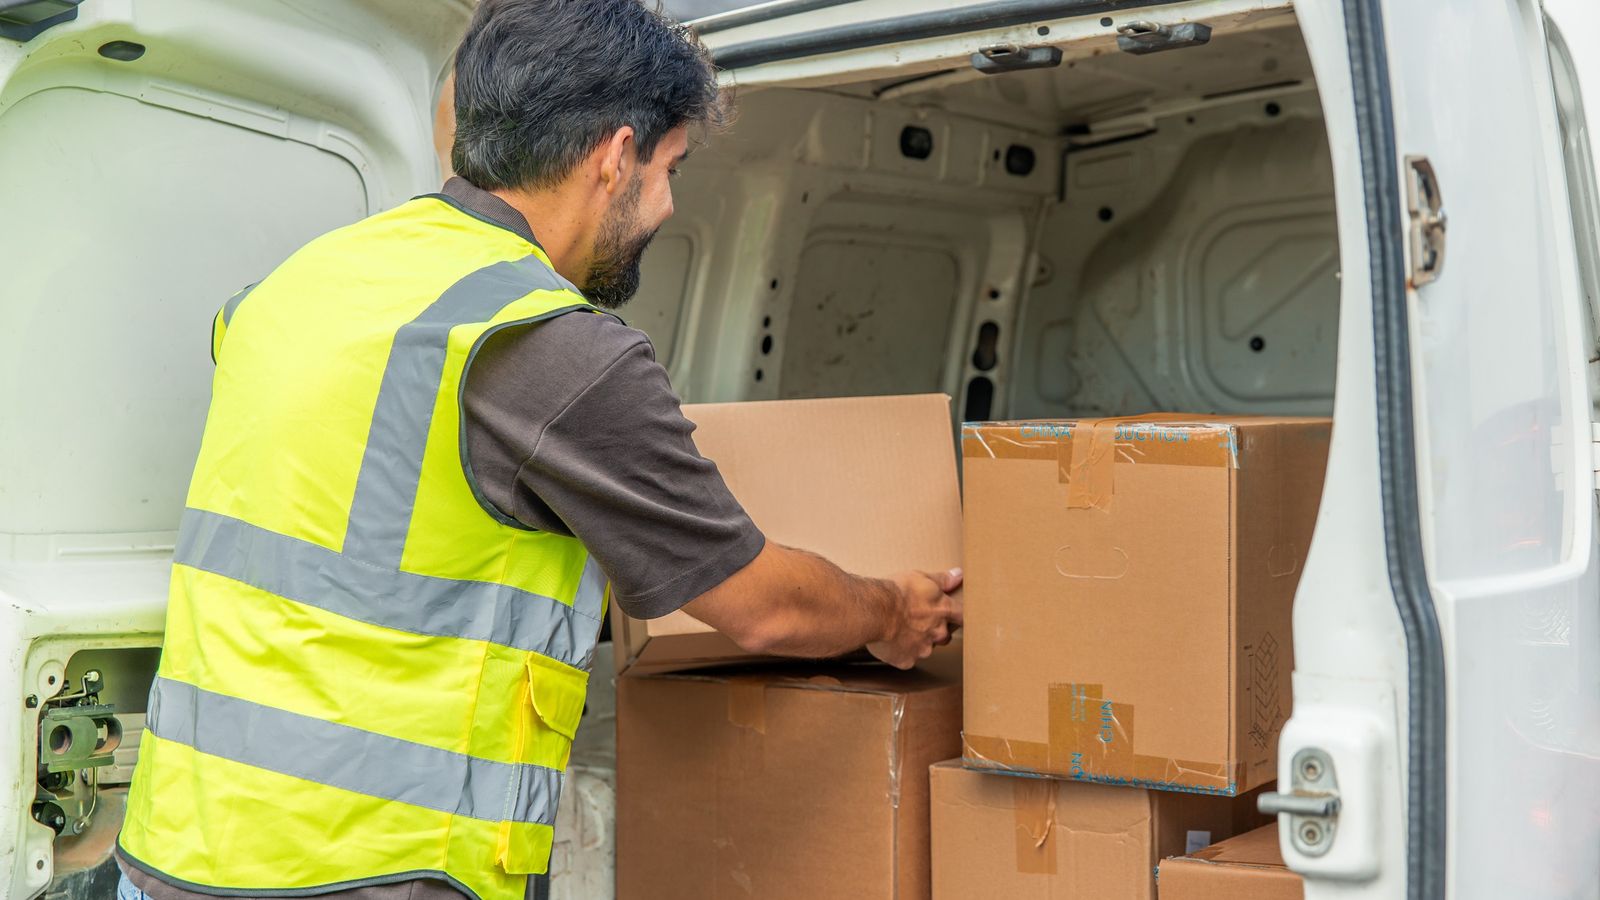
- Vans are the gap. Clean Cities' June release, based on Department for Transport data, counted 100,761 diesel vans registered to companies in London at the end of 2025, a record, against 5,582 battery electric vans: about 18 diesel vans for every electric one. Company diesel cars, by contrast, fell from 78,100 at the end of 2015 to 22,400 at the end of 2025. The group says diesel vans are now the biggest transport source of NOx in central and inner London and is calling for a zero-emission zone for freight. That is a campaign proposal, not a decision by the Mayor or Transport for London.
What it means for your business
Nothing changes today. The ranking is a campaign group's assessment, and the EU limits it uses do not apply in the UK. No new charge or zone for vans has been announced. But if you run vans in London, this is the debate to watch, because the call is aimed at company fleets and the numbers point at diesel vans.
Air pollution and carbon are different, but the fix is often the same. NO2 and particles are not greenhouse gases and are not in your carbon footprint. The CO2 from the same diesel is: fuel burned in a van you own or lease is Scope 1. An electric van has no exhaust, and its charging is Scope 2 at the UK grid factor, which is why the CO2e per mile is much lower as well.
A worked example: five vans in London
Take an illustrative London business running 5 average vans (up to 3.5 tonnes), each doing 15,000 miles a year, on the 2026 government factors:
- As diesels: 0.41386 kg CO2e a mile, or 31.04 tonnes CO2e a year in Scope 1.
- As battery electric vans: 0.06856 kg CO2e a mile, or 5.14 tonnes a year in Scope 2.
- That is about 83% less, or 25.90 tonnes CO2e a year for the fleet, before the well-to-tank and grid loss lines that a full report adds. If you have fuel receipts rather than mileage, report the litres instead: that is more accurate.
What to do now
- Know your fleet's numbers. Record each van's miles or fuel every month. You need them for your carbon report anyway, and they are what you would use to plan a switch.
- Look at replacement dates. Clean Cities' proposal follows a Dutch model where new vans bought after a set date must be electric. If a van is due for replacement in the next few years, price an electric one now. Our post on electric van registrations in October 2026 has the latest market figures, and the depot charging scheme post covers help with chargers.
- Keep an eye on London's rules. Any new zone would be for the Mayor and Transport for London to decide, and past changes such as the ULEZ expansions went through public consultation first.