What happened
China's carbon dioxide emissions fell by 3.1% in the third quarter of 2026 compared with the same quarter of 2025, according to a new analysis for Carbon Brief by Lauri Myllyvirta, lead analyst at the Centre for Research on Energy and Clean Air, published on 6 November 2026. Based on official figures and commercial data, it is the largest quarterly fall since the 2022 Covid lockdowns, and it leaves China's emissions down an estimated 0.5% so far this year. China is the world's largest emitter, so a fall there moves the global total. The main findings:
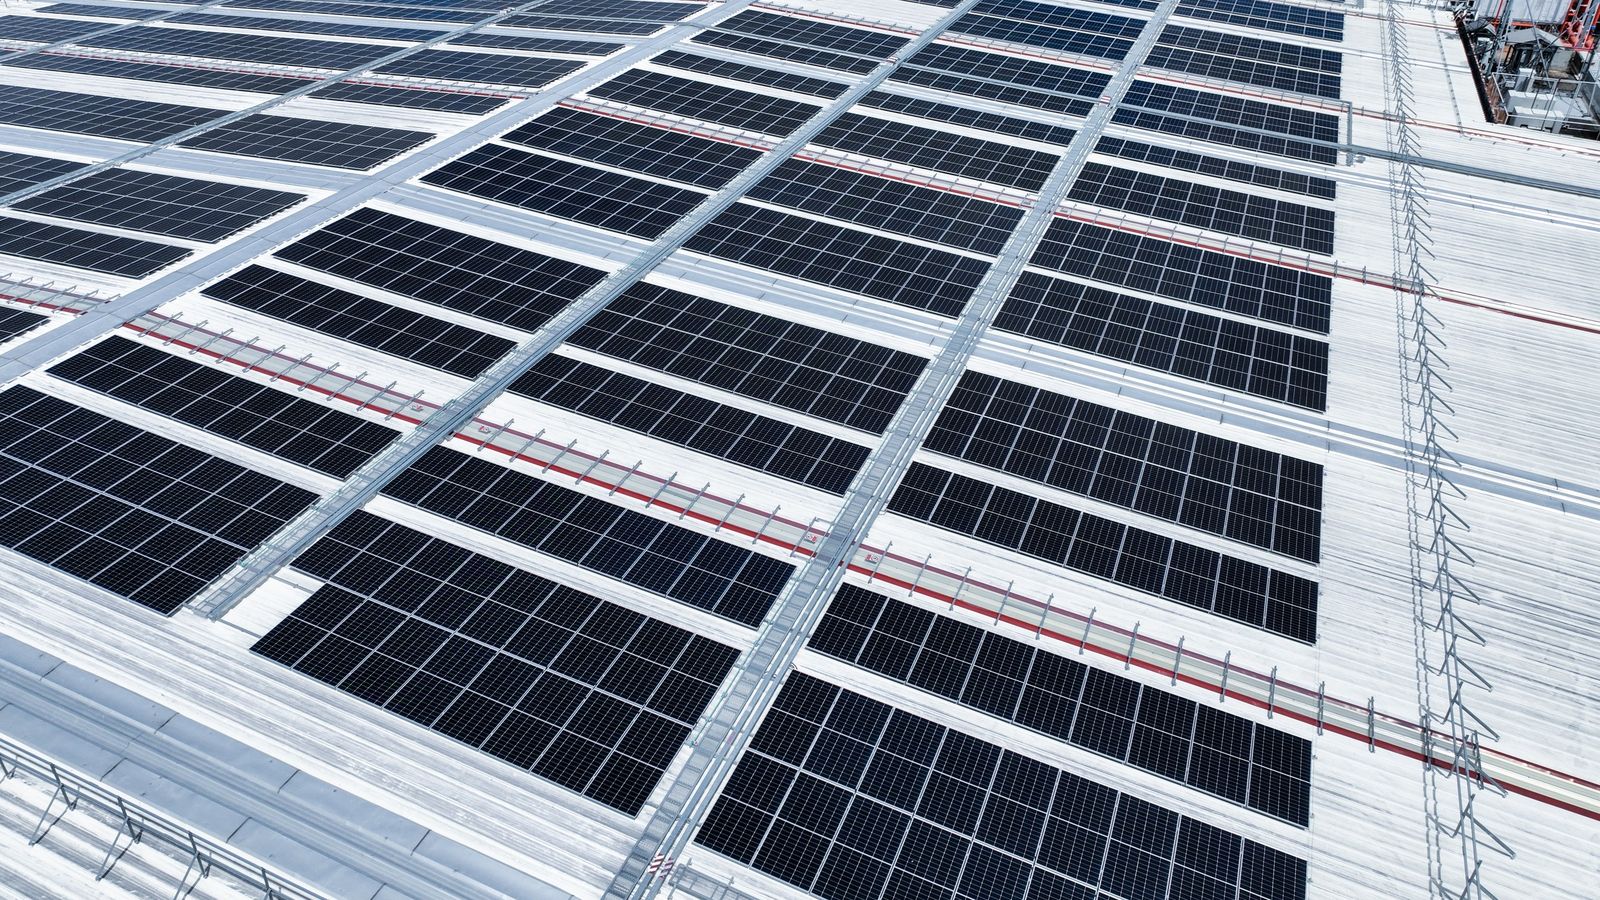
- Less coal for power. Coal use fell 3% year on year and coal-fired generation 3.3%. Power from solar, wind and nuclear rose by 110 terawatt hours, more than twice the growth in total electricity demand, even though China is still building new coal plants at near-record rates.
- Less oil on the roads. Oil use fell 4%, and oil used for transport 9%. Electric vehicles reached a record 67% of passenger car sales and 50% of heavy truck sales in September.
- Industry cooling. Growth in the coal-to-chemicals industry slowed, and emissions from cement and steel kept falling as construction shrank.
- A trend, not a one-off. The analysis says emissions have been "flat or falling" since March 2024. Mild weather and slower economic growth held demand down this quarter, so the outlook depends on clean power continuing to outpace demand.
The analysis also links the fall in oil demand to the continuing Hormuz crisis. Amber Rolt reported the findings for BusinessGreen on the same day.
What it means for your business
Goods made in China carry China's grid. If you buy products, parts or packaging from China, the electricity used to make them is part of your Scope 3 emissions (category 1, purchased goods). China's grid is still far more carbon-intensive than the UK's, so for many UK importers it is one of the biggest numbers in their footprint. A cleaner Chinese grid will bring that number down over time.
Your factor will not change this year. Official grid factors lag by a year or more. China's latest official national figure is for 2023, and that is what you use until a newer one is published. Our China electricity factors by province page has the official figure for every province, which is more accurate than the national average when you know where your supplier's factory is.
Suppliers may start quoting lower figures. Some Chinese manufacturers buy renewable power or have solar on site and will give you a lower, supplier-specific figure. That is better data than a grid average, but ask what it is based on and which year it covers before you use it.
A worked example: a factory in China
Take an illustrative UK business whose goods are made in a Chinese factory that uses 500,000 kWh of electricity a year to make them. The quantity is an assumption for the example.
- On China's official national average for 2023 (0.5306 kg CO2 per kWh): 265.30 tonnes CO2.
- The same electricity on the 2026 UK government factor: 65.48 tonnes CO2e.
The Chinese figure is about 4.1 times the UK one. China's official factor counts CO2 only, while the UK factor is CO2e, so the true gap is slightly wider. This is why the factory's location, and the province it is in, matters more to your Scope 3 than almost anything else about the goods.
What to do now
- List what you buy from China. Spend or weight by supplier is enough to start. Our guide to the Scope 3 categories shows where purchased goods fit.
- Find out where the factories are. A province figure from our China factors page is more accurate than the national average.
- Ask your biggest suppliers for their own figures. If they buy renewable power or generate their own, ask for the evidence and the year it covers, and keep it with your workings.